
The Greater Cambridge Partnership (GCP) glossy salesman’s brochure makes some bold statements about air pollution, so let us look at it and compare it to the GCP’s own Strategic Outline Case (SOC) report and the Council’s data.
The GCP brochure is very keen to express how poor air the air quality is in Cambridge; the brochure has a headline graphic just for that…
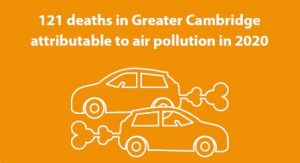
So, where does this figure originate? After all, it is a headline number used throughout the consultation.
Let us look at the Executive summary in Strategic Outline Case (SOC). This is the document commissioned by the GCP as the basis for the whole proposal.
It states;
Poor air quality with 106 deaths each year in Greater Cambridge attributable to air pollution
GCP SOC document
So not 121. Going through all of the SOC, it flip-flops between 120 and 106. It never gives the number 121. In fact, the number 121 only appears as a page number in the entire thing.
So, who is right? The brochure and GCP’s own SOC disagree. Is there anywhere to see where the basis of the numbers could have come from?
Well, there is, let’s take a look at Cambridge City Council’s environmental health data. It’s on their website. They produce a report every year. Taking a look at the last two years, after all, we are after current data.
From the 2022 Air Quality Annual Status Report
“Public Health data indicates that in 2020, 48 deaths in Cambridge could be attributed to Particulate Air Pollution.“
Cambridge Council 2022 Air Quality Report
From the 2021 Air Quality Annual Status Report
“Public Health data indicates that in 2019, 43 deaths in Cambridge (5.6%) could be attributed to Particulate Air Pollution.“
Cambridge Council 2021 Air Quality Report
If we take the lowest GCP figure and the highest council figure to bring the numbers as close as possible, the GCP appears to overstate the numbers by some 220%.
Could the GCP reveal the sources for the various statistics given in the report, especially as different numbers are given in their own report?
Now I suppose there could be some semantics here in that Cambridge City isn’t the same area as the Greater Cambridge area. However, the GCP makes no distinction between the two. So the higher figure might be a much wider area. Fair enough, so we will take a peek at those numbers. GCP state 106, City Council state 48, a difference of 58, or 54% of the total. So if 54% of the deaths from air pollution are from outside the City, how will the STZ on the City of Cambridge impact those?
Whilst we are here, let us take a look at some actual data. We have the data from the Council’s 24/7 air pollution monitoring system. Well, it’s good news. Air pollution is down by over 50% on 2007 levels, following a downward trend. The graph below is from the Cambridge City Council’s published data.
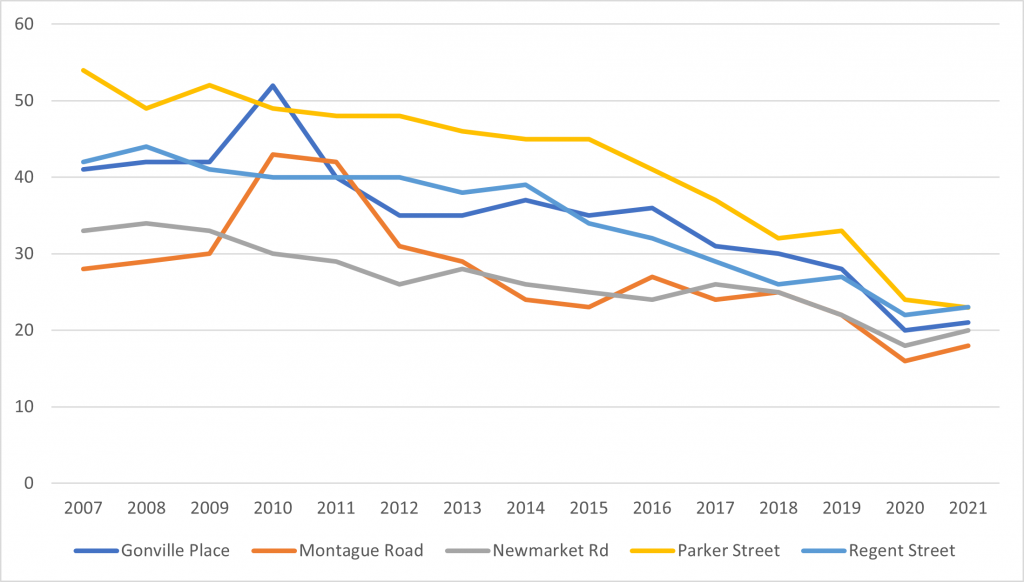
Could it be better? Yes, it could. You can see the impact of Covid causing the “bounce” in 2021 post the lockdowns of 2020. The GCP SOP report states;
“The main source of emissions in Cambridge is from road traffic. Buses account for 49% of the nitrogen oxide emissions in the city centre”
Should not all buses now be electric and reduce pollution by 49%? Ideally, yes; in reality, no. With the GCP scheme looking to increase the bus fleet from 170 to 300, it will get worse; buses will not all need to be electric until the end of the decade.