
The Greater Cambridge Partnership (GCP) states congestion is a problem. A fundamental problem, huge.
A bold claim, but is it true? Is there any data available to support this sweeping statement?
You may want to sit down, this could take a couple of minutes.
The GCP only provide this single statistic in the salesman’s brochure. So we will have to delve into the Strategic Outline Case (SOC) to find the data to back this up.
The SOC has the word congestion in it 209 times. The phrase ‘reduce congestion’ 23 times. The SOC also has numerous references to reducing levels to “15% below the 2011 baseline”, ten times in fact. However, the SOC doesn’t seem to give any numbers for the 2011 baseline or the current levels. The GCP has commissioned many reports, graphs, and modelling of various charge rates and their impact on traffic numbers and flows.
So presumably, the GCP has some raw data of it’s own. The baseline must have a source, there must have been historical data going back to 2011—way back when before the GCP was just a twinkle in some politician’s eye.
So we must go back to the Council’s websites and collect some data. Behold the Cambridgeshire County Council annual traffic monitoring report. A thing of beauty. The Council have undertaken comprehensive surveys for many years. Crucially the reports also contain the magic 2011 baseline numbers too. The Council has been using the same data collection points since 1978, so the data should be excellent. You can get them yourselves by clicking here. This data has been used for years for the Council to base decision on, so if it’s good enough for that, it’s good enough for us.
Let us look at the latest report.
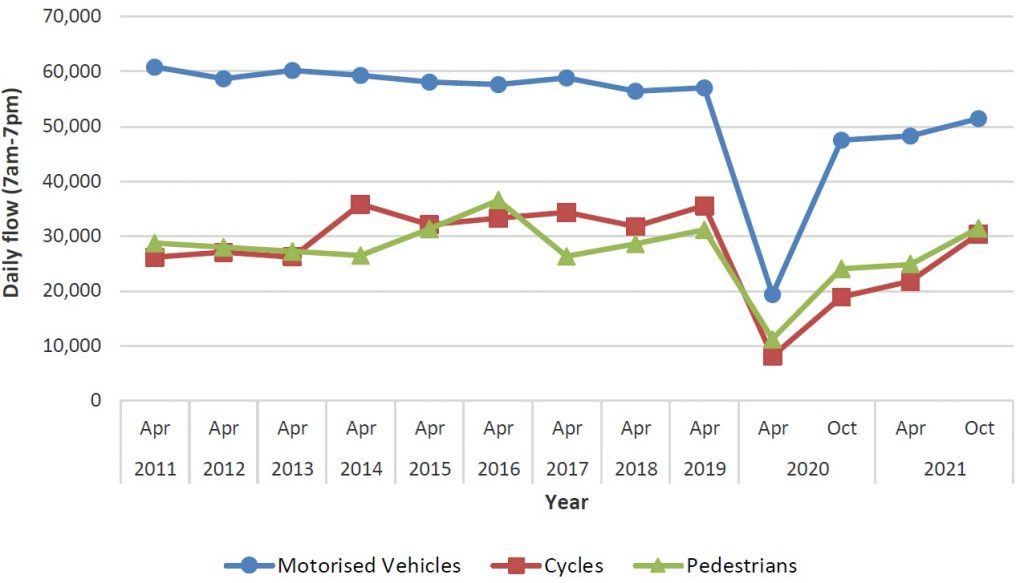
On Wednesday 6th October 2021, just under 187,000 movements were recorded crossing the Cambridge City boundary between 7am and 7pm. Of these movements, 93% were motorised vehicles (motorcycles, cars, LGVs, HGVs and buses), 5% were pedal cycles and 2% were pedestrians. The October 2021 volume is an increase of 8% compared to the level recorded in 2020 but represents a decrease of 14% compared to 2019 and a decrease of 6% compared to 2011. This indicates that volumes entering / exiting the city are lower than they were prior to the pandemic.
Cambridge County council, Traffic Monitoring Report 2021, Headline for Cambrige
Yes, that day was indeed a school day.
The report, as the headline point for the Cambridge City Boundary ( or Radials ) screen line, says traffic was 6% lower than the 2011 baseline. The GCP says we need to get traffic back down to these kind of levels. We need to take 50% of the cars off the road to get back down to those levels.
Surely this cannot be correct, it must be a typo. So rather than get on a soap box and shout that figure far and wide, we shall and continue through the report.
To the sound of flipping pages, we read on and find item 3.3.3 in the report.
Table 6 presents the change in the daily volume of movements across the city
Cambridge County council, Traffic Monitoring Report 2021, item 3.3.3
boundary (7am-7pm) relative to a base of October 2011 (index 100). This
demonstrates that most types of travel reduced during October 2020, as expected. It
also demonstrates that as of October 2021, total volumes crossing the city boundary
were lower than they were in October 2011. This is particularly true for motorcycle
volumes which are 40% lower crossing the city boundary despite being over 100%
higher crossing the river. Most modes crossing the city boundary are below the level
recorded in 2011 with the exception of LGVs (+3%), pedal cycles (+1%) and
pedestrians (+59%).
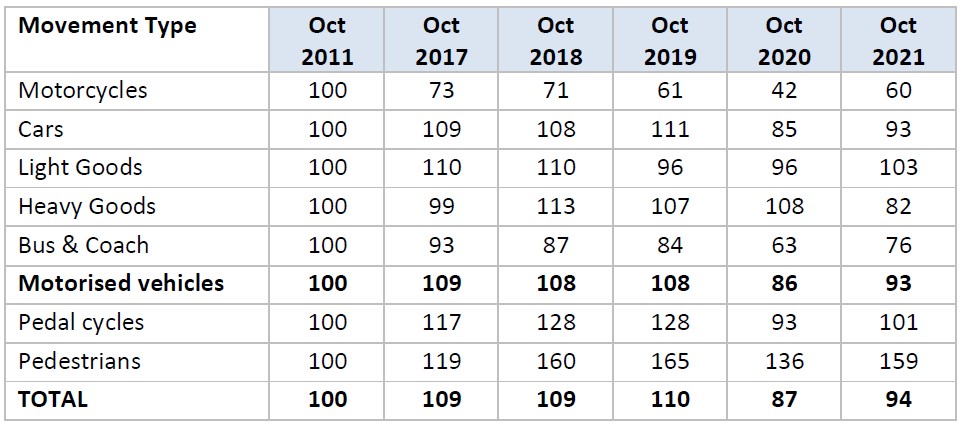
Yes, the numbers look a little strange. It is called a growth index table. The 2011 numbers show the 100% value. The baseline, if you will. The value to which everything else is judged. So if the number is over 100, it is an increase above the 2011 baseline. You may have guessed that a number lower than 100 is a decrease below the 2011 baseline.
Ah ha, you cry! You’re going to say traffic levels are down in 2021. Nope, that would not be fair. There was the small matter of the Pandemic in 2020, so we shall use the pre-pandemic numbers from 2019. Things are still yet to get back to pre-pandemic levels. It is a different musing about changes in working practices affecting traffic volumes.
Car movements were up 11% compared to the baseline in 2019. True. The Zone can’t disagree. It’s there in black and white. Cycling was also up 65% compared to pre-pandemic levels. Go, cyclists!
But, checks and balances, checks and balances. So, what is the City Boundary?
The City Boundary, or city radial, is an area outside the City itself. It is the same sort of boundary the proposed STZ would have. So many cars in this data could be heading to the Park and Ride sites (P&R). The GCP want this; it is good news. So tea and medals all around to those to do that.
To check, let us look at some P&R data from the same report. Does it go up between 2017 and 2019?

Indeed, P&R passenger numbers are up too. The data supports the theory that at least some of that increase in traffic is already doing what the GCP want it to do.
Let us continue our delve into the report. If this traffic stops at the Park and Ride, what is happening within the City? We still need to get down to 15% below the 2011 baseline by removing 50% of the cars from the roads.
We turn to the second part of the survey, using a second ‘screen line’ to monitor traffic where it crosses the River Cam. Again, possibly not perfect, but to quote the report.
Traffic flows entering and travelling within Cambridge have been monitored comprehensively since 1978 ussing two screenlines
Cambridge County council, Traffic Monitoring Report 2021, Introduction
So what are the numbers from the traffic surveys for this inner screen line?
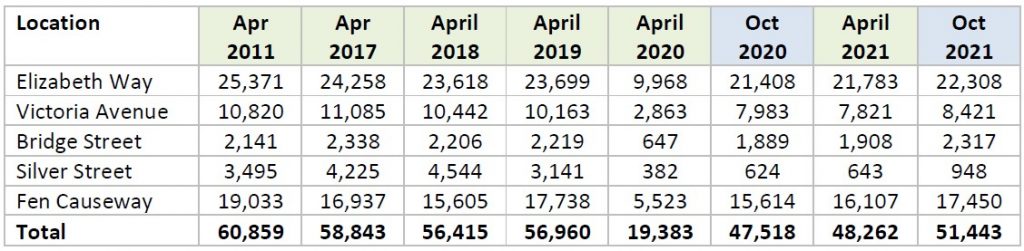
Now the Zone may need to get a calculator out here, stick a tongue out at just the right angle, and punch some buttons. At first glance, those numbers look down on the 2011 baseline. Even the pre-pandemic 2019 numbers.
The traffic report also contains a growth index table for the River Cam screen line, which is easier on the eye than raw numbers.
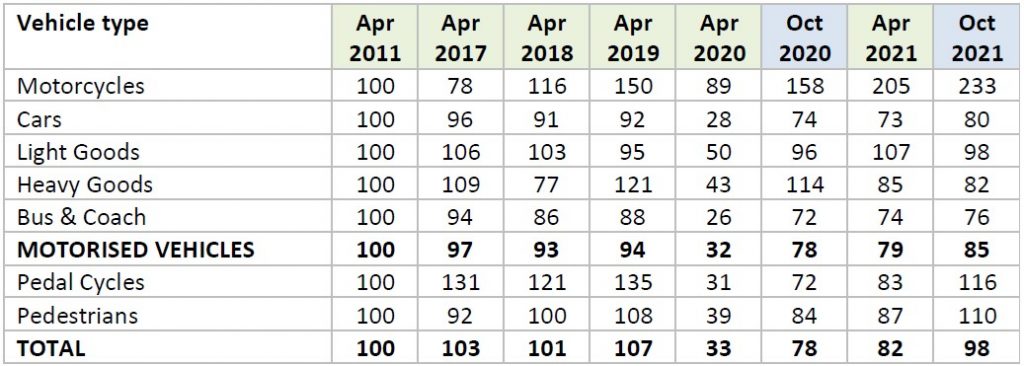
How about as a picture, everyone likes a picture.
What? The total growth index for motorised vehicles pre-pandemic was 94. 6% down on the 2011 baseline figure. Yet the GCP requires us to remove 50% of the cars and get down to 15% below the 2011 baseline.
Is anyone good with a spreadsheet who can work out how that adds up?
If the GCP target is the baseline 2011 numbers less 15% the abacus gives us figure of 51,730. But to get there we have to cut traffic by 50%, so we shall increase this figure by 50% to get to where the GCP believe we are now. Again some furious work with the abacus, and have a number of 77,595. The GCP and the Council’s own data disagree, the GCP traffic levels are 27% higher than the Council’s own data. That is a huge error. Huge.
There is a flaw in all the above. Happy to admit that. This is based on old data, data of the physical world. The here and now. Not the future data, of when all these new areas of growth and opportunity are built and lived in. However, Dave Baigent from the GCP states that the population of Cambridge has risen by 17% in the last 10 years. And yet the traffic levels in the City have fallen. The traffic surveys are hard to dispute, they are hard numbers, physically taken. What we hear from the GCP, perhaps not so much?
Indeed, some 33,5000 more homes are expected in the Greater Cambridge area by 2030. The majority of these are outside the City itself. Those inside the City area are planned to deter private vehicle ownership. The traffic statistics above appear to show that despite traffic heading toward Cambridge having increased, it seems to stop and make use of the P&R facilities. There is no reason to believe that will change.
Unless the GCP’s data being out by 27% has this extra traffic factored in already? Who knows?
Congestion, what about the congestion?
Congestion, the elephant in the room. Where to begin.
We all remember when congestion wasn’t like it is today. Everything was so much better in the past. So ponder this.
If the number of metal cans driving around on the roads is lower than before, how can congestion at peak times be so much worse?
Let us be logical about this problem. The Zone is a lover of logic, it is a wonderful thing.
Congestion happens when too many vehicles, want to be on the same bit of road, at the same time.
If the Council’s data says the volume of traffic has gone down, that means the traffic that is there must all want to be on the same bit of road. At the same time.
What would force a smaller volume of traffic, to all be on the same bits of road, at the same time.
The Zone wonders if anyone has mapped the location of the bus gates, road closures, and modal filters built by the GCP over the years.
Could such things be used to manoeuvre a lower traffic volume, onto a restricted set of roads, so generate congestion?
Just a thought.