
Before going any further, get comfy. Grab a mug or glass of something enjoyable. This may take a while. You will not need an abacus. You will be getting homework.
Surveys are beautiful things. Surveys are used worldwide to gather a fantastic variety of information, from how cats may like a particular brand of food to endorsing politicians’ decisions to impose life-changing events on their constituents.
You know the kind of thing, “The majority of you asked for it, so here it is!” can be heard up and down the land.
On their own, surveys are bland. Often people don’t bother to fill them in. How many times have you been stopped in the street by someone wanting to ask some questions but walked on by? After all, your lone response will be drowned out by all the others who have stopped and been asked questions such as “Would you rather have a ride on an elephant or an alpaca?”. So what is the point, you say? Everyone knows the elephant will win.
However, surveys produce another wonderful thing. Statistics.
Statistics, noun
the practice or science of collecting and analysing numerical data in large quantities, especially for the purpose of inferring proportions in a whole from those in a representative sample
Everyone loves statistics. Statistics condense the questions in surveys into simple things. Simple indisputable digestible nuggets of information. The statistics that 8 out of 10 cats like eating HappyTiddles is clear. To clarify, we shall say that 80% of cats like eating HappyTiddles. After all, 8 out of 10 is the same numerically as 80 out of 100, which also happens to be 80%.
The Zone asks you to think about the wording above; “80% of cats like eating HappyTiddles”. Does this mean that 80% of *all* cats like eating it? No, it does not. But that small matter has neatly been brushed under the carpet—no need to worry about that.
The context has been lost by simply swapping “8 out of 10” to 80%. The context is what was the sample size of the survey. So let us look at the definition of statistics again.
Statistics, noun
the practice or science of collecting and analysing numerical data in large quantities, especially for the purpose of inferring proportions in a whole from those in a representative sample
In the original 8 out of 10, the sample size is clearly given to you. It was 10 cats rather than all the available cats. However, 80% is missing the context of the size of the sample. The Zone will leave the question “Is 10 a representative sample of the number of available cats” for you to decide.
The Greater Cambridge Partnership (GCP) proposals for the Sustainable Travel Zone (STZ) are out for consultation. The basis for the recommendations is from feedback received to questions they have asked of you, the people. The GCP is surveying you to garner your opinion, even your endorsement or approval, to steam ahead. They want your feedback. Sadly, no elephants or alpacas are involved; nothing so simple.
The glossy salesman’s brochure, used as the primary means to garner your feedback, contains some statistics. As does the flyer going through letterboxes. Beautiful statistics are graphically presented to make it very clear what they mean.
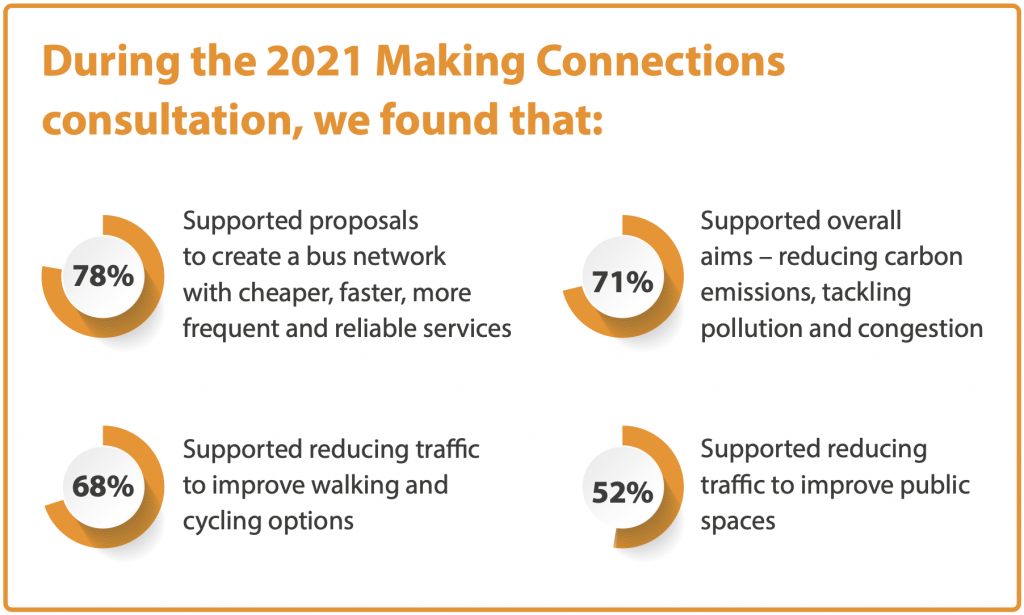
Based on that single graphic, it is evident that you, the people, really want and endorse what the GCP is proposing. You are behind it. The majority agrees. Yes?
So let us take a look at the full report of the 2021 Consultation. You can grab your copy by clicking here if you wish to follow along.
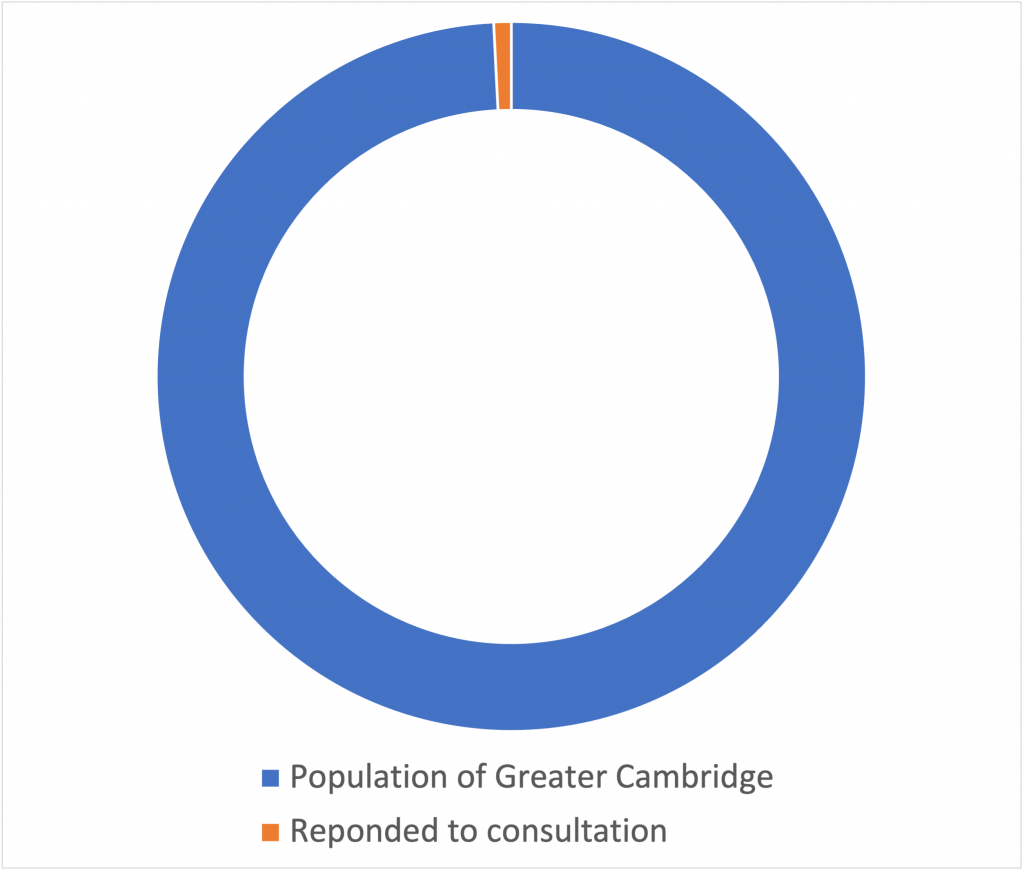
The total number of responses to the 2021 Consultation was 2,441. Given that 8,652 people visited the webpage hosting the survey, assuming that none visited more than once, only 27% of those who found the online response completed it. This website has been visited by more users in a week than the GCP had in 6 weeks the consultation was open.
Some 2,366 completed it online, and three printed and submitted their response as a hard copies (they posted them). A further 72 responded via e-mail. These proposals impact the Greater Cambridge area, the affected population of which the GCP informed us is 307,700.
The Zone shall follow the GCP in presenting this graphically. However, the 78% who support the proposals in relation to the population of the Greater Cambridge area are here in all their glory.
Understandably that may have come as a bit of a shock. So take a moment.
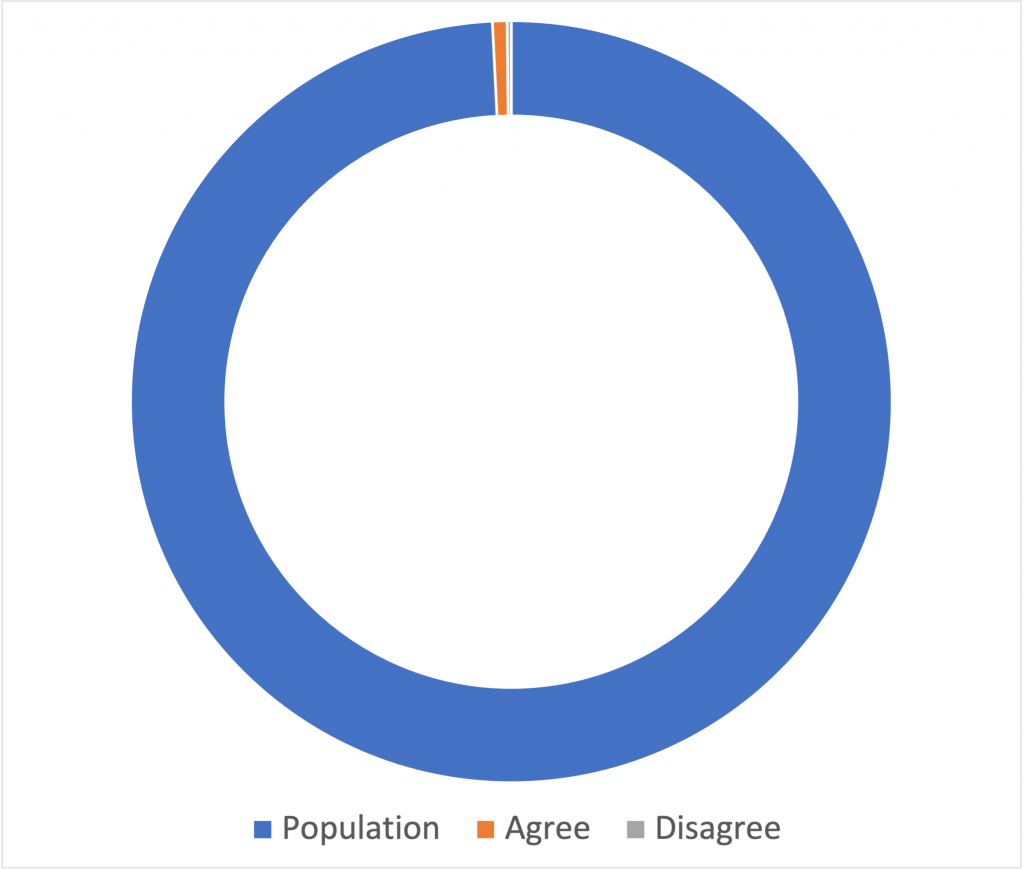
With the aid of the Zone’s abacus, 0.79% of the Greater Cambridge area population responded to the consultation. Those who supported proposals to create a bus network with cheaper, faster, more frequent and reliable services was 0.62% of the population.
So when you see the headline statistics broadcast far and wide, remember the representative sample size of the population who support or not the GCPs proposal is tiny.
If you are very quiet, you will hear the sound of Statisticians, mathematicians, and marketing executives’ teddies being thrown out of windows all over Cambridge. They are an intelligent bunch in Cambridge. That is not how this kind of thing is done; they will be shouting, you’ve totally missed the point.
We could get into the mathematics of survey sizes, Confidence Levels, Margins of error and the like. But we won’t. The theory of how surveys work are complex. We could also delve into the question of significance tests. We won’t, but then neither did the GCP.
We will, however, brush upon the subject of Sampling Bias.
Sampling bias here is very important. It can occur when some population members are systematically more likely to engage than others. So a higher proportion of the returns submitted have a more significant impact on the overall result. Ergo, the result can show a bias.
Hypothetically there could be sampling bias within the responses returned to the GCP. But, unfortunately, it is impossible to know.
For example, local pressure groups could encourage members to engage in such consultations. There would be nothing against this. It is what pressure groups do all the time. Some groups may go as far as walking their members and supports through each survey question, providing recommended answers. Maybe as far as offering sample text to put into comments boxes on the survey. You can see such an example by clicking here.
If just paid up membership of a single pressure group of some 1,600 people completed the last 2021 consultation, let alone any unpaid supporters, there could be a bias of up 62%.
Naturally, the way questions are worded can also bias a survey. Multiple-choice questions that ask to support or oppose a series of unpalatable answers do not always help.
The Zone has a simple message for everyone, both for and against the GCP proposals.
Engage with the consultation people.
The Zone does not attempt to or suggest what your response should be. That is a matter for you. All your circumstances are different. If petitions are running, by all means sign up for the ones of your choice. They will, however, be ignored in the official decision-making process. They help provide the pulse of the population but contain no data the policymakers can use.
Do not ignore it because your response will be lost in the crowd.
Do not ignore it because “the decision has already been made”.
Do not ignore it because it’s too hard to do or you don’t have the time.
Complete the consultation.
If you know of an neighbour or friend who could not complete it themselves, talk to them. Submit a response with their answers. The survey lets you do that, there is even a tick box for it.
Do your homework, research how does it affect you. Not just now, but in the coming years. Then submit your response. No excuses that the dog ate it, or you simply have to watch all 73 episodes of Game of Thrones first.
You can click here for the consultation website page.
You can click here to start an e-mail to the GCP, and it will even put the subject line in to save you the effort.
Oh, and would like to ride an elephant or an alpaca?